If you want a random yes/no answer to a question, like “who should kick-off this football match?” it’s very common to entrust the decision to the flip of a coin, on the assumption that the coin doesn’t care which side gets the advantage.
But what if that trust is misplaced? What if the coin gives the answer “tails – your opponent kicks-off” more often than “heads – you kick-off”, and so gives the advantage to your opponent more often than to you? And, most importantly, how could you tell if the coin is biased before you entrust your decision-making to it?
One answer is to perform a statistical test on a sample of coin-flips, and to see whether the number of heads is lower than you would expect if the coin were fair. In this post, we’ll see how to do this from scratch for coin-flipping, so that when you do more complex tests, you have a better idea of what they’re doing under the hood.
A statistical test is a way of choosing whether to reject a hypothesis. So, before you consider a statistical test, you should have in mind at least one clear hypothesis:
- The null hypothesis, H0, which usually states something like “there is no difference between A and B”, e.g. “this coin has the same probability of coming up heads as tails”.
You might also have in mind another hypothesis…
- The alternative hypothesis, H1, which states something at odds with the null hypothesis: “there is a difference between A and B”, e.g. “this coin is biased, and produces – on average – more heads than tails when flipped”.
However, proper handling of alternative hypotheses will have to wait for another post.
If you collected just a single piece of data – a single coin-flip – then you would have absolutely no idea of whether the coin is biased, because the chance of a single head is exactly the same as the chance of a single tail: 50%, or 0.5. We can plot these two probabilities against the number of heads to produce a probability distribution (technically, a probability mass function) like this:
![Probability distribution for one flip of a fair coin [CC-BY-SA-3.0 Steve Cook]](http://www.polypompholyx.com/wp-content/uploads/2014/01/probability_distribution_one_flip-300x190.png)
The probability of getting zero heads from just one flip of a fair coin, is 0.5; and the probability of getting one head from one flip is also 0.5.
OK, so how about a few more flips? If you did three coin-flips and got not a single head, you might suspect something were awry, but most people wouldn’t bet money on it. Why? Well, if the coin is fair, the probability of getting a head on any given flip is 0.5, and so too is the probability of getting a tail. Furthermore, every flip of the coin is independent of the last – unless you’re a fraudulent coin-flipping genius with terrifying motor control. So, assuming that the coin is fair, and that you are fairly clumsy, the chances of zero heads from three coin-flips is 0.5 (for the first tail) times 0.5 (for the second) times 0.5 (for the third) = 0.53 = 0.125 = 12.5%, i.e. it’s something that will happen more than 10% of the time.
However, if you did thirty coin-flips and got not a single head, you’d be almost certain the coin were biased, and the maths backs this up: 0.530 is, as near as damn-it, a 1 in a billion chance. It’s not impossible that the coin is unbiased – experiments can never rule anything out completely! – but this would be a particularly unlikely fluke.
But what if you got 10 heads in 30 coin-flips? Or 3 heads in 10? Or 8 heads in 40? What number of failures to get a head in a sample of flips would be enough to convince you the coin were biased? Indeed, how many times should you flip the coin to check its fairness anyway?
Let’s take the example of two flips of an unbiased coin. The possible results from two flips are:
- HH
- HT
- TH
- TT
The probability of zero heads is 0.5×0.5 = 0.25.
The probability of one head and one tail is 2×0.5×0.5 = 0.5, because there are two different combinations in which you can get a single head and a single tail (HT or TH).
The probability of two heads is 0.5×0.5 = 0.25.
If we plot these probabilities against the number of heads, as before, we get this distribution:
Note that the heights of the bars are in the ratio 1:2:1, showing the 1 way you can get zero heads, the 2 ways you can get a head and a tail, and the 1 way you can get two heads.
![Probability distribution for two flips of a fair coin [CC-BY-SA-3.0 Steve Cook]](http://www.polypompholyx.com/wp-content/uploads/2014/01/probability_distribution_two_flips-300x190.png)
For three flips, there are eight possibilities:
- HHH
- HHT
- HTH
- THH
- HTT
- THT
- TTH
- TTT
The probability of zero heads is 0.5×0.5×0.5 = 0.53 = 0.125. The probability of one head and two tails is 3×0.5×0.5×0.5 = 0.375, because there are three different combinations of one head and two tails. The same is true of two heads and one tail; and the probability of three heads (zero tails) is the same as for three tails, 0.125. Here’s the graph for three flips of a fair coin; again note the ratio: this time it’s 1:3:3:1.
![Probability distribution for three flips of a fair coin [CC-BY-SA-3.0 Steve Cook]](http://www.polypompholyx.com/wp-content/uploads/2014/01/probability_distribution_three_flips-300x190.png)
And finally, for four flips, there are 16 possible outcomes, each with a probability of 0.54=0.0625:
- HHHH
- HHHT
- HHTH
- HTHH
- THHH
- HHTT
- TTHH
- HTTH
- THHT
- THTH
- HTHT
- TTTH
- TTHT
- THTT
- HTTT
- TTTT
There is 1 way to get zero heads, 4 ways to get one head, 6 ways to get two heads, 4 ways to get three heads, and 1 way to get four heads.
![Probability distribution for four flips of a fair coin [CC-BY-SA-3.0 Steve Cook]](http://www.polypompholyx.com/wp-content/uploads/2014/01/probability_distribution_four_flips-300x190.png)
You may recognise the ratio of the bars in these graphs from Pascal’s triangle, where each number is formed by summing together the two numbers diagonally above it:
![Pascal's triangle [CC-BY-SA-3.0 Conrad Irwin]](http://www.polypompholyx.com/wp-content/uploads/2014/01/pascals_triangle-300x216.png)
Pascal’s triangle [CC-BY-SA-3.0 Conrad Irwin]
The probability distributions graphed above are three specific examples of the
binomial distribution, which can be calculated in the general case using the following formula:
 = \binom{n}{k} P^k (1-P)^{n-k} = \frac{n!}{k!(n-k)!} P^k (1-P)^{n-k}")
- pmf(k, n, P) is the probability of getting k heads in a particular sample of size n, where the probability of a head on any particular flip, P, is 0.5.
- P is the long-run probability of the coin giving you a head, i.e. the ratio of the number of heads to the total number of coin-flips for some extremely large sample. For a fair coin, this will be 0.5.
- n is the number of coin-flips you have sampled.
- (n,k) is the binomial coefficient from Pascal’s triangle, which can be calculated from scratch using factorials (3! = 3×2×1, etc.) if you are a masochist.
For a fair coin, p=0.5, and this formula simplifies to:
 = \binom{n}{k} 0.5^n")
To see whether a coin is fair, we would like to know how likely it is that the number of heads we get in a sample is consistent with a coin that gives heads 50% of the time and tails 50% of the time. We are much more likely to be convinced that getting 10 heads in 30 flips (33% heads) means the coin is biased, than we would be by getting 0 heads in 1 flip, even though that’s an superficially much more damning 0% heads. So it is clear that our opinion about the coin’s fairness will depend critically on n, the number of coin-flips we collect. This is called the sample size.
In this sort of statistical testing, the first thing we do is to define a null hypothesis. In this case, our null hypothesis is that the coin is fair. Under the null hypothesis, the probability of getting a head on a particular flip is 0.5.
We then assume that the null hypothesis really is true, and we ask ourselves: what probability distribution of results would we get, assuming that the null hypothesis is true? For the coin-flip, we’d get a binomial distribution of results: the number of heads in a sample of size n would be modelled by the equation shown above.
We then collect our sample of coin-flips. Let’s say we collect 30 in this case, so n = 30. We can then generate the precise probability distribution for a fair coin, flipped 30 times. It looks like this:
![Probability distribution for thirty flips of a fair coin [CC-BY-SA-3.0 Steve Cook]](http://www.polypompholyx.com/wp-content/uploads/2014/01/probability_distribution_thirty_flips-300x214.png)
Code for (nearly) this graph is:
P<-0.5
n<-30
k<-c(0:n)
pmf<-dbinom(k, size=n, prob=P)
names(pmf)<-k
barplot( pmf, space=0, xlab="Number of heads", ylab="pmf" )
dbinom |
The function dbinom(k, size=n, prob=P) is R’s implementation of the probability mass function pmf( k, n, P ) discussed above. The ‘d’ stands for density, because for continuous distributions, the equivalent of a probability mass function is called a probability density function.dbinom(k, size=n, prob=P) gives you the probability of k heads in a sample of size n with a coin producing heads at prob P.
dbinom(10, size=30, prob=0.5) gives the probability of getting 10 heads in 30 flips of a fair coin.
Other distributions have similar density functions available: dnorm (normal), dpois (Poisson), dt (t), df (F), etc. |
Here we pass dbinom a vector of values of k between 0 and n, which returns a vector containing the whole probability distribution. The names function can be used to give names to the items in the probability distribution, which is useful for labelling the x-axis of a barchart.
Let’s say that only 10 of the 30 flips were heads. As you can see from the graph above, this is far into the left tail of the probability distribution. The vast majority of possible outcomes of 30 coin-flips contain more than 10 heads. It is therefore pretty unlikely that 10 heads in 30 flips is consistent with the null hypothesis that the coin is unbiased. We would probably be happy to reject the null hypothesis, but can we be a little more objective (or at least consistently subjective!) about the criterion for rejection?Yes, we can. We can work out from the model exactly how likely is it that 30 coin-flips would produce 10 or fewer heads. It’s important that we include ‘or fewer’, because if we’re convinced of bias by 10 heads out of 30, we’d be even more convinced by 5 out of 30, or 0 out of 30. This can be worked out from the cumulative distribution function for the binomial distribution. This is found for 10 heads by simply summing up the the probabilities for 10, 9, 8 … 2, 1, or 0 heads; and more generally by summing up the probabilities “below” a given number of heads. Here is the cumulative distribution for 30 coin-flips:![Cumulative distribution for thirty flips of a fair coin [CC-BY-SA-3.0 Steve Cook]](http://www.polypompholyx.com/wp-content/uploads/2014/01/cumulative_distribution_thirty_flips-300x235.png) 0.04937 is just slightly less than 0.05, or 5%, or 1-in-20.R helpfully has a function for calculating the cumulative distribution function.
0.04937 is just slightly less than 0.05, or 5%, or 1-in-20.R helpfully has a function for calculating the cumulative distribution function.
pbinom |
The function pbinom(k, size=n, prob=P) is R’s implementation of the cumulative distribution function discussed above. The ‘p’ stands for p-value.pbinom(k, size=n, prob=P) gives you the probability of getting k or fewer heads in a sample of size n with a coin producing heads at prob P
pbinom(10, size=30, prob=0.5) gives the probability of getting 10 heads or fewer in 30 flips of a fair coin, which is 0.04937.
Other distributions have similar p-value functions available: pnorm (normal), ppois (Poisson), pt (t), pf (F), etc. |
Assuming our coin is fair, there is only a 1-in-20 chance that we would get 10 or fewer heads in a sample of 30. We call this probability the p value. On both graphs, I’ve marked the region where the p value is less than 0.05 in red. Note that the p value is not the same thing as the probability of the coin producing a head, which I’ve symbolised as P above.
qbinom |
The function qbinom(p, size=n, prob=P) is R’s implementation of the inverse cumulative distribution function, which was useful for working out which columns should be red on the graph. The ‘q’ stands for quantile. qbinom(p, size=n, prob=P) gives the number of heads in a sample of size n with a coin producing heads at prob P for which the cumulative distribution function first exceeds p.
qbinom(0.05, size=30, prob=0.5) gives the number of heads in 30 flips of a fair coin for which p first exceeds 0.05, so this returns 11 (remember that 10 heads out of 30 has a p value of just under 0.05, so we’d need 11 for a p value of at least 0.05).
Other distributions have similar quantile functions available: qnorm (normal), qpois (Poisson), qt (t), qf (F), etc. |
In scientific writing, the results of statistical tests with p values less than 0.05 are called statistically significant, and those with p values greater than 0.05 statistically insignificant. This cut-off at 0.05 is essentially arbitrary, and sometimes 0.01 or 0.001 are used instead, but 0.05 is used fairly widely in science as the threshold for “significant” data.The concept of p-values and the use of statistical significance as a way of analysing data were first proposed by Ronald Fisher. Fisher’s “significance testing” approach tends to get confused (even by scientists!) with the conceptually different “hypothesis testing” approach of Jerzy Neyman and Egon Pearson, which we’ll visit in a later post. It’s important to know what a p value is to at least give you a chance of avoiding this confusion yourself.The p value is the probability of obtaining a test statistic at least as extreme as the one that was actually observed, assuming that the null hypothesis is true.It is not the probability that the null hypothesis is true, or that the alternative hypothesis is false. It is not the probability the results are a fluke. It is not even the probability that you have rejected the null hypothesis incorrectly. All the p value tells you for this experiment is how probable it is that 10 or fewer heads would be observed from 30 flips of a fair coin: the answer is “not very”.To sum up:
- The null hypothesis was that the coin was fair, so we can therefore assume that the probability of any one flip coming up heads is 0.5.
- The test statistic we have obtained from our data is simply the number of heads, which is 10. In other kinds of statistical test, the test statistic will usually be something more complex.
- The probability of obtaining 10 heads was worked out using a reference distribution, the binomial.
- Generating this reference distribution requires one additional parameter, and that is the sample size, n, which was 30.
- If we follow this procedure, we get a p value less than 0.05, and therefore we can – perhaps! – say that the data we have collected are inconsistent with the null hypothesis of a fair coin.
All this rigmarole sounds like a lot of effort, and it is. This is why you’re using R. The whole of the analysis above can be done automatically for you by simply typing:
binom.test( 10, 30, p=0.5, alternative="less" )
Exact binomial test data: 10 and 30 number of successes = 10, number of trials = 30, p-value = 0.04937
alternative hypothesis: true probability of success is less than 0.5
95 percent confidence interval: 0.0000000 0.4994387
sample estimates: probability of success 0.3333333
This carries out a binomial test for 10 ‘successes’ (heads) in 30 ‘trials’ (coin-flips), assuming that the coin is fair. The p argument in the call to the function is the probability of success in a single trial, which we called P above, not the p value. The letter “p” tends to get rather overloaded with conflicting meanings in statistics, so be careful about what is is being used to symbolise in any given circumstance. We also specify that the we’re only interested in whether there are less (fewer!) successes than we’d expect. You’ll note the resulting p value is as we calculated above. The test described above is a one tailed test, as we have only checked to see whether the coin is biased towards tails. In general, we’d use a two tailed test, because a coin that produces an excess of heads is just as biased as one that produces an excess of tails, and – without good reason to suspect bias in one direction or the other – we should be prepared for either form of bias. This changes the analysis a little, as we’d be looking at the tails on both sides of the probability distribution, but the principles are the same.
Other kinds of statistical test, such as F, and t, and χ² are more complex, and – unlike this exact test – they only estimate p values based on some additional assumptions, rather than calculate them exactly from first principles. One reason for this is that – for example – calculating precise binomial p values for large values of n requires creating some pretty enormous numbers (because of all those factorials: 30! = 265252859812191058636308480000000). This becomes impractically slow and/or inaccurate, making it more practical to use approximations that are less computationally intractable. However, inexact tests are still doing similar things under the hood. They compare a test statistic (e.g.t) derived from your data, to a reference distribution (e.g. Student’s t) that you’d expect to get assuming the null hypothesis is true (“the means of two samples are the same”), and accounting for any important parameters of the data (degrees of freedom). They then return a p value that tells you how probable it is that a test statistic at least as extreme as the one you actually got would have been observed, assuming the null hypothesis is true.A very reasonable question to ask at the end of all this is: how many times should you flip the coin to see if it is biased? That very reasonable question unfortunately has a very long answer, and will require another post!
Exercises
- But what if you got 3 heads in 10?
- Or 8 heads in 40?
- And what if you didn’t care whether the coin was biased to heads or to tails, for 8 heads in 40?
- What is the largest number of heads you would consider significant at p=0.05, for a sample size of 100 flips? You’ll need the
qbinom function, which will return the smallest value of k for which the cumulative distribution function is larger than your p value.
- Produce a barchart of the probability distribution for n=40, like the one shown in the post for n=30. For extra happiness, colour the left and right p=0.025 tails red. You’ll need the
col to the barplot function, which can take a vector of colours such as "red" and "white" as an value.
- Produce a barchart of the cumulative distribution for n=40, like the ones shown in the post for n=30. For extra happiness, colour the left and right p=0.025 tails red. You’ll need the
pbinom function, which will return the cumulative distribution function for each value of k.
Answers
- 3 in 10, one-tailed: not significantly less that what you’d expect, given the null.
binom.test( 3, 10, p=0.5, alternative="less" )
        Exact binomial test
data:  3 and 10
number of successes = 3, number of trials = 10, p-value = 0.1719
alternative hypothesis: true probability of success is less than 0.5
95 percent confidence interval:
 0.0000000 0.6066242
sample estimates:
probability of success
                   0.3
- 8 in 40 one-tailed, significantly less than you’d expect, given the null.
binom.test( 8, 40, p=0.5, alternative="less" )
        Exact binomial test
data:  8 and 40
number of successes = 8, number of trials = 40, p-value = 9.108e-05
alternative hypothesis: true probability of success is less than 0.5
95 percent confidence interval:
 0.0000000 0.3320277
sample estimates:
probability of success
                   0.2
- 8 in 40 two-tailed, [still] significantly different from what you’d expect, given the null. Note that the p value is double the p value from the previous answer: this is because the 5% is now divided half-and-half between the ‘extremely few heads’ tail of the probability distribution, and the ‘extremely many heads’ tail. This makes it harder for a two-tailed test to give you a significant p value than a one-tailed test. Consequently – as we scientists are a conservative lot – we generally use the two-tailed version of tests unless there is some extremely good reason not to.
binom.test( 8, 40, p=0.5 )
        Exact binomial test
data:  8 and 40
number of successes = 8, number of trials = 40, p-value = 0.0001822
alternative hypothesis: true probability of success is not equal to 0.5
95 percent confidence interval:
 0.09052241 0.35647802
sample estimates:
probability of success
                   0.2
- The largest number of heads in a sample of 40 that would still give p=0.05 is either 14 (for a one-tailed test) or 13 (for a two-tailed test). Note that the
qbinom function returns the smallest value of k such that pmf(k, n, P) ≥ p, i.e. it returns the next value of k ‘up’ from the number of heads we’d consider suspicious.
qbinom(0.05, size=40, prob=0.5)
15
qbinom(0.05/2, size=40, prob=0.5)
14
- Graph of 40-flip PMF. We set up a vector called
colorcode containing 41 copies of the word “white”, and then modify this to “red” for the items in colorcode whose corresponding values of k have a CDF of less than 0.025. Note the use of a conditional in the subscript call to colorcode, and that because we want both tails, we need those values with CDFs less than 0.025 (or greater than 0.975).
P<-0.5
n<-40
k<-c(0:n)
p.crit<-0.05/2

pmf<-dbinom(k, size=n, prob=P)
names(pmf)<-k

# Values of k below k.crit have a cumulative probability of less than p.crit
k.crit<-qbinom(p.crit, size=n, prob=P)

colorcode<-c( rep("white", n+1) )
colorcode[ k < k.crit ]<-"red"
colorcode[ k > n-k.crit ]<-"red"

barplot( pmf, space=0, xlab="Number of heads", ylab="pmf", col=colorcode )
![Probability distribution for forty flips of a fair coin [CC-BY-SA Steve Cook]](http://www.polypompholyx.com/wp-content/uploads/2014/01/probability_distribution_forty_flips-300x231.png)
- Graph of 40-flip CDF. Note that the p-value for 13-or-fewer plus 27-or-more is actually a fair bit less than 0.05 (it’s about 0.038), but because the distribution is symmetrical, if we took the next two values (14 and 26) and added them to the tails too, we’d get a p value of 0.081, which is larger than 0.05. As the distribution is discrete, we can’t do anything but err on the side of caution and exclude 14 and 26 from the tails.
P<-0.5
n<-40
k<-c(0:n)
p.crit<-0.05/2

cdf<-pbinom(k, size=n, prob=P)
names(cdf)<-as.character(k)

k.crit<-qbinom(p.crit, size=n, prob=P)

colorcode<-c( rep("white", n+1) )
colorcode[ k < k.crit ]<-"red"
colorcode[ k > n-k.crit ]<-"red"

barplot( cdf, space=0, xlab="Number of heads", ylab="cdf", col=colorcode )
segments( 0, p.crit, n+1, p.crit, col="red" )
segments( 0, 1-p.crit, n+1, 1-p.crit, col="red" )
![Cumulative distribution for forty flips of a fair coin [CC-BY-SA-3.0 Steve Cook]](http://www.polypompholyx.com/wp-content/uploads/2014/01/cumulative_distribution_forty_flips-300x241.png)
Next up… Statistical power


![Pallet boards [CC-BY-SA-3.0 Steve Cook]](http://www.polypompholyx.com/wp-content/uploads/2014/06/pallet_boards.jpg)
![Woodlice simulator [CC-BY-SA-3.0 Steve Cook]](http://www.polypompholyx.com/wp-content/uploads/2014/06/woodlice_simulator.png)


![Milvus milvus [CC-BY-2.0 Alex Lomas]](http://www.polypompholyx.com/wp-content/uploads/2014/06/Milvus_milvus.jpg)
![flying_machines [CC-BY-SA-3.0 Steve Cook]A](http://www.polypompholyx.com/wp-content/uploads/2014/06/flying_machines.jpg)
![Edinburgh botanical gardens Gunnera [CC-BY-2.0 Alex Lomas]](http://www.polypompholyx.com/wp-content/uploads/2014/04/edinburgh_gunnera.jpg)
![Kew gardens temperate house [CC-BY-2.0 Alex Lomas]](http://www.polypompholyx.com/wp-content/uploads/2014/04/kew_gardens_temperate_house.jpg)
![Kew gardens Nepenthes [CC-BY-SA-3.0 Steve Cook]](http://www.polypompholyx.com/wp-content/uploads/2014/04/kew_gardens_nepenthes.jpg)
![Kew gardens Araucaria [CC-BY-2.0 Alex Lomas]](http://www.polypompholyx.com/wp-content/uploads/2014/04/kew_araucaria.jpg)
![Chelsea physic garden ropes [CC-BY-SA-3.0 Steve Cook]](http://www.polypompholyx.com/wp-content/uploads/2014/04/chelsea_physic_garden_ropes.jpg)
![Edinburgh botanical gardens [CC-BY-2.0 Alex Lomas]](http://www.polypompholyx.com/wp-content/uploads/2014/04/edinburgh_botanical_gardens.jpg)
![Edinburgh botanical gardens Lycopodium [CC-BY-SA-3.0 Steve Cook]](http://www.polypompholyx.com/wp-content/uploads/2014/04/edinburgh_lycopodium.jpg)
![Barcelona botanical gardens Xanthorrhoea [CC-BY-SA-3.0 Steve Cook]](http://www.polypompholyx.com/wp-content/uploads/2014/04/barcelona_xanthorrhoea.jpg)
![Amsterdam botanical gardens [CC-BY-2.0 Alex Lomas]](http://www.polypompholyx.com/wp-content/uploads/2014/04/amsterdam_botanical_gardens.jpg)
![Amsterdam botanical gardens cannabis [CC-BY-2.0 Alex Lomas]](http://www.polypompholyx.com/wp-content/uploads/2014/04/amsterdam_cannabis.jpg)
![Oxford botanical gardens Pachypodium [CC-BY-SA-3.0 Steve Cook]](http://www.polypompholyx.com/wp-content/uploads/2014/04/oxford_botanical_gardens_pachypodium.jpg)
![Berlin botanical gardens [CC-BY-2.0 Alex Lomas]](http://www.polypompholyx.com/wp-content/uploads/2014/04/berlin_botanical_gardens.jpg)
![Berlin botanical gardens Welwitschia [CC-BY-2.0 Alex Lomas]](http://www.polypompholyx.com/wp-content/uploads/2014/04/berlin_welwitschia.jpg)
![Edinburgh botanical gardens Gnetum [CC-BY-SA-3.0 Steve Cook]](http://www.polypompholyx.com/wp-content/uploads/2014/04/edinburgh_gnetum.jpg)
![Diadema setosum [CC-BY-SA-3.0 Steve Cook]](http://www.polypompholyx.com/wp-content/uploads/2014/02/Diadema_setosum.jpg)

![Gastrulation [CC-BY-SA-3.0 Steve Cook]](http://www.polypompholyx.com/wp-content/uploads/2014/03/gastrulation.png)
![v = \frac{ v_{max} \cdot [S] }{ K_M + [S] }](https://s0.wp.com/latex.php?latex=v+%3D+%5Cfrac%7B+v_%7Bmax%7D+%5Ccdot+%5BS%5D+%7D%7B+K_M+%2B+%5BS%5D+%7D&bg=ffffff&fg=000000&s=0 "v = \frac{ v_{max} \cdot [S] }{ K_M + [S] }")
![Acid phosphatase saturation kinetics scatterplot [CC-BY-SA-3.0 Steve Cook]](http://www.polypompholyx.com/wp-content/uploads/2014/01/acid_phosphatase_saturation_kinetics_scatterplot.png)
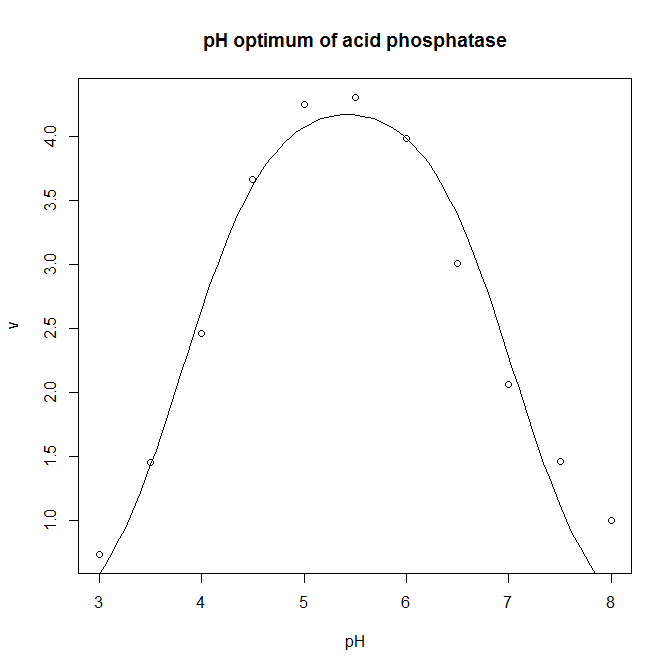
![Acid phosphatase nonlinear regression model [CC-BY-SA-3.0 Steve Cook]](http://www.polypompholyx.com/wp-content/uploads/2014/01/acid_phosphatase_nonlinear_regression_model.png)

![\mu = \frac{ \mu_{max} }{ 1 + e^{ - \frac{ (\ln{[X]} - \ln{IC_{50}} ) }{ s } } }](https://s0.wp.com/latex.php?latex=%5Cmu+%3D+%5Cfrac%7B+%5Cmu_%7Bmax%7D+%7D%7B+1+%2B+e%5E%7B+-+%5Cfrac%7B+%28%5Cln%7B%5BX%5D%7D+-+%5Cln%7BIC_%7B50%7D%7D+%29+%7D%7B+s+%7D+%7D+%7D&bg=ffffff&fg=000000&s=0 "\mu = \frac{ \mu_{max} }{ 1 + e^{ - \frac{ (\ln{[X]} - \ln{IC_{50}} ) }{ s } } }")
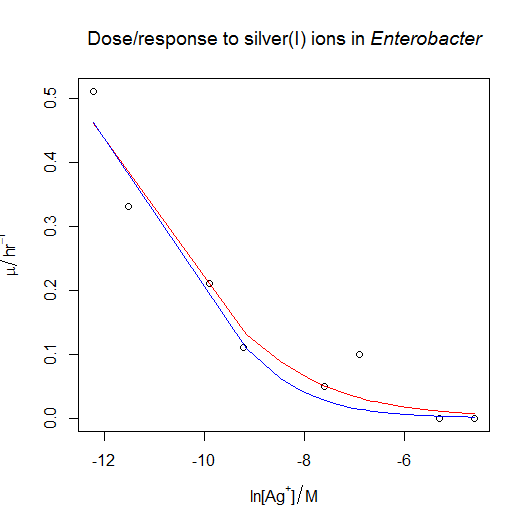
![Dose-response nonlinear regression model [CC-BY-SA-3.0 Steve Cook]](http://www.polypompholyx.com/wp-content/uploads/2014/01/dose_response_nonlinear_regression_model.png)


![Bacterial growth nonlinear model [CC-BY-SA-3.0 Steve Cook]](http://www.polypompholyx.com/wp-content/uploads/2014/01/bacterial_growth_nonlinear_model.png)
![\mu = \frac{ \mu_{max} }{ 1 + e^{ (\ln{[X]} - \ln{IC_{50}} ) } }](https://s0.wp.com/latex.php?latex=%5Cmu+%3D+%5Cfrac%7B+%5Cmu_%7Bmax%7D+%7D%7B+1+%2B+e%5E%7B+%28%5Cln%7B%5BX%5D%7D+-+%5Cln%7BIC_%7B50%7D%7D+%29+%7D+%7D&bg=ffffff&fg=000000&s=0 "\mu = \frac{ \mu_{max} }{ 1 + e^{ (\ln{[X]} - \ln{IC_{50}} ) } }")
![Species-area relationship for Caribbean herps [CC-BY-SA-3.0 Steve Cook]](http://www.polypompholyx.com/wp-content/uploads/2014/03/species_area_relationship_caribbean_herps.png)
![Wheat yield interaction plot [CC-BY-SA-3.0 Steve Cook]](http://www.polypompholyx.com/wp-content/uploads/2014/01/wheat_yield_interaction_plot.png)
![Glucose interaction plot [CC-BY-SA-3.0 Steve Cook]](http://www.polypompholyx.com/wp-content/uploads/2014/01/glucose_interaction_plot.png)
![Glucose boxplot [CC-BY-SA-3.0 Steve Cook]](http://www.polypompholyx.com/wp-content/uploads/2014/01/glucose_boxplot.png)
![Cuckoo eggs boxplot [CC-BY-SA-3.0 Steve Cook]](http://www.polypompholyx.com/wp-content/uploads/2014/02/cuckoo_eggs_boxplot.png)
![Cuckoo eggs null model [CC-BY-SA-3.0 Steve Cook]](http://www.polypompholyx.com/wp-content/uploads/2014/02/cuckoo_eggs_null_model.png)
![Cuckoo eggs ANOVA model [CC-BY-SA-3.0 Steve Cook]](http://www.polypompholyx.com/wp-content/uploads/2014/02/cuckoo_eggs_anova_model.png)
![Cuckoo eggs residuals [CC-BY-SA-3.0 Steve Cook]](http://www.polypompholyx.com/wp-content/uploads/2014/02/cuckoo_egg_residuals.png)
![Cuckoo eggs normal QQ plot [CC-BY-SA-3.0 Steve Cook]](http://www.polypompholyx.com/wp-content/uploads/2014/02/cuckoo_egg_normal_qq_plot.png)
![Venus flytrap boxplot [CC-BY-SA-3.0 Steve Cook]](http://www.polypompholyx.com/wp-content/uploads/2014/01/venus_flytrap_boxplot.png)
![Venus flytrap residuals [CC-BY-SA-3.0 Steve Cook]](http://www.polypompholyx.com/wp-content/uploads/2014/01/venus_flytrap_residuals.png)
![Venus flytrap normal QQ plot [CC-BY-SA-3.0 Steve Cook]](http://www.polypompholyx.com/wp-content/uploads/2014/01/venus_flytrap_normal_qq_plot1.png)
^2 }{ E } }")

![Maize kernel histogram [CC-BY-SA-3.0 Steve Cook]](http://www.polypompholyx.com/wp-content/uploads/2014/01/maize_kernel_histogram.png)

![Cricket chirps scatterplot [CC-BY-SA-3.0 Steve Cook]](http://www.polypompholyx.com/wp-content/uploads/2014/01/cricket_chirps_scatterplot.png)
![Cricket chirps linear model [CC-BY-SA-3.0 Steve Cook]](http://www.polypompholyx.com/wp-content/uploads/2014/01/cricket_chirps_linear_model.png)
![Cricket chirps null model [CC-BY-SA-3.0 Steve Cook]](http://www.polypompholyx.com/wp-content/uploads/2014/01/cricket_chirps_null_model.png)
![Cricket chirps residuals [CC-BY-SA-3.0 Steve Cook]](http://www.polypompholyx.com/wp-content/uploads/2014/01/cricket_chirps_residuals.png)
![Cricket chirps normal QQ plot [CC-BY-SA-3.0 Steve Cook]](http://www.polypompholyx.com/wp-content/uploads/2014/01/cricket_chirps_normal_qq_plot.png)


![Sycamore seeds linear model [CC-BY-SA-3.0 Steve Cook]](http://www.polypompholyx.com/wp-content/uploads/2014/01/sycamore_seeds_linear_model.png)
![NADH linear model [CC-BY-SA-3.0 Steve Cook]](http://www.polypompholyx.com/wp-content/uploads/2014/01/nadh_linear_model.png)
![NADH normal QQ plot [CC-BY-SA-3.0 Steve Cook]](http://www.polypompholyx.com/wp-content/uploads/2014/01/nadh_normal_qq_plot.png)

![Species-area log-log linear model [CC-BY-SA-3.0 Steve Cook]](http://www.polypompholyx.com/wp-content/uploads/2014/01/species_area_log_log_linear_model.png)
![Probability distribution for one flip of a fair coin [CC-BY-SA-3.0 Steve Cook]](http://www.polypompholyx.com/wp-content/uploads/2014/01/probability_distribution_one_flip.png)
![Probability distribution for two flips of a fair coin [CC-BY-SA-3.0 Steve Cook]](http://www.polypompholyx.com/wp-content/uploads/2014/01/probability_distribution_two_flips.png)
![Probability distribution for three flips of a fair coin [CC-BY-SA-3.0 Steve Cook]](http://www.polypompholyx.com/wp-content/uploads/2014/01/probability_distribution_three_flips.png)
![Probability distribution for four flips of a fair coin [CC-BY-SA-3.0 Steve Cook]](http://www.polypompholyx.com/wp-content/uploads/2014/01/probability_distribution_four_flips.png)
![Pascal's triangle [CC-BY-SA-3.0 Conrad Irwin]](http://www.polypompholyx.com/wp-content/uploads/2014/01/pascals_triangle.png)
![Probability distribution for thirty flips of a fair coin [CC-BY-SA-3.0 Steve Cook]](http://www.polypompholyx.com/wp-content/uploads/2014/01/probability_distribution_thirty_flips.png)
![Cumulative distribution for thirty flips of a fair coin [CC-BY-SA-3.0 Steve Cook]](http://www.polypompholyx.com/wp-content/uploads/2014/01/cumulative_distribution_thirty_flips.png)
![Probability distribution for forty flips of a fair coin [CC-BY-SA Steve Cook]](http://www.polypompholyx.com/wp-content/uploads/2014/01/probability_distribution_forty_flips.png)
![Cumulative distribution for forty flips of a fair coin [CC-BY-SA-3.0 Steve Cook]](http://www.polypompholyx.com/wp-content/uploads/2014/01/cumulative_distribution_forty_flips.png)